
South New Brighton, Christchurch
2,672 council reports since June 2015, the 52nd busiest suburb in the city. 2,175 photographs on record. 3,420 people at the 2023 Census, 2,459 to the square kilometre across 1.4 km².
The record also holds about $640 a week to rent· 2023 Census snapshot· 2,175 photographs· 3 old photographs· 1 school· 4 parks· 1 track· 3 names on the map· 16.4% of the outline mapped liquefied· graded mostly TC3 in 2011· the record drew water over 29% of the outline· the mapped tsunami reach covers 83% of the outline· the Ngāi Tahu schedule covers 30% of the outline· ecological sites over 28% of the outline· landscape schedules over 49% of the outline· high flood hazard over 22% of the outline· setback strips over 1% of the outline· 925 SCIRT photographs filed on this ground· 5 remembered names on this ground· 9 drawn rules bind this ground· 49 parcels of made ground· 3 parcels with a cleanup on file· the 2019 model grades this ground mostly possible· 19 council structures on the register· 13 recreation register records· 507 trees on the register· the plan’s word on this ground· 1% of the outline reserved· the plan’s exceptions touch 1% of the outline· 8 epicentres inside the outline· 25 injury crashes· 332 recorded victimisations· 15 bus stops· 4 businesses· the council’s fix times· 40 documents· 5 mentions on the wire
Live source links
Link-outs to the source’s own live pages, chch.live does not copy their live values or source text.
Living here rent · the ground · the day-to-day
$640/week
middle half $520–$650
New bonds here ran at about $640 a week in the April–June 2026 quarter, the middle half of them between $520 and $650, across 15 bonds lodged, up 9% on a year ago. That’s about $90 a week above the city’s own quarter median of $550. Tenancy Services counts these under the “South New Brighton” statistical area, close to this suburb’s outline, not exactly it.
By dwelling type and bedrooms, April–June 2026 quarter
- 1-bedroom house, $650 a week · 9 new bonds
Median and quartiles of weekly rents on new private bonds, by quarter. New bonds are fresh lodgements, not the whole rental stock; under five bonds the rent is withheld, and counts are randomly rounded. Source: Tenancy Services rental bond data: provisional while the bond system migrates.
The ground: the February 2011 survey drew liquefaction over 16% of it; the 2011 grading filed it mostly TC3, the rest of the watch is drawn further down.
Day to day it holds 1 school, 4 parks, 1 track and 15 bus stops, each is counted further down.
Lately the record’s mostly rubbish & dumping, 315 reports in the year to 14 October 2026, the newest 13 October 2026.
One for the quiz, Its busiest day on record was 8 July 2020, 28 reports in a single day.
2023 Census snapshot SA1 areas grouped here
About 3,321 people and 1,296 occupied private households in the “South New Brighton” statistical area, grouped from 23 SA1 areas. This exact statistical-area match is close to this suburb’s outline, not exactly it.
More of the 2023 Census
- Born overseas20% of stated birthplace
- European ethnicity92% of ethnicity responses
- Māori ethnicity15% of ethnicity responses
- Pacific Peoples ethnicity4% of ethnicity responses
- Asian ethnicity3% of ethnicity responses
- Households with internet87% of stated households
- Households with two or more vehicles58% of stated households
Ethnicity is a multiple-response measure, so those percentages are not meant to add to 100%.
Stats NZ’s 2023 Census uses fixed random rounding to base 3. Unavailable or confidential cells are left out, not treated as zero. individuals · households · geography · CC BY 4.0.
About the suburb
South New Brighton is a coastal suburb on the eastern side of Christchurch city. The area previously had some Māori presence. The suburb also contains a primary school.
As reported 2,175 on record
The suburb, back then 3 in the archive
Placed by the record’s locality join or the name in its own title, a lead, not a claim each frame stood here.
The shape of it outline © OpenStreetMap · recent reports, pinned
The record on South New Brighton
- South New Brighton enters the written record on 11 August 1868, “Page 2 Advertisements Column 1 (Grey River Argus, 11 August 1868)”, Papers Past.
- “South New Brighton” appears somewhere in 26 of the archive’s records, title, description or body.
- A Papers Past search for the name surfaced 31 records, leads by provenance, not by phrase.
- The first report the feed ever carried here: roading/streets, 12 June 2015, at 373.
- Its busiest day on record was 8 July 2020, 28 reports in a single day.
- The street that keeps coming up is Estuary Road, reported on 375 separate days.
- For elections the suburb’s centre falls inside Coastal ward, the Coastal-Burwood-Linwood community board is its local layer. The whole roll is at /wards.
Lately the newest reports


Park - General Request419 Marine Parade
On beach,entrance Beatty Street. Used to be a small driftwood tippee for kids for the longest time has recently turned into a substantial structure with table…

Hazard, vehicle221 Pine Avenue
car parked across my driveway which I have right of way- the car has around 3 feet infront of it to pull forward.


Overgrown Vegetation424 Marine Parade
garden rubbish under Large Macrocarpa Trees. reported this 3 weeks ago but has not been picked up. we need 2 b mindful that we are heading into a very hot…


Dumped Rubbish376 Estuary Rd
Broken mirror dumped opposite 377 Estuary Rd, has been there more than a week

Public ToiletCanterbury
This is a well used amenity and it’s a shame they are closed. There is no information re why and where the closet amenity is. Hopefully fixed soon


Dumped RubbishCanterbury
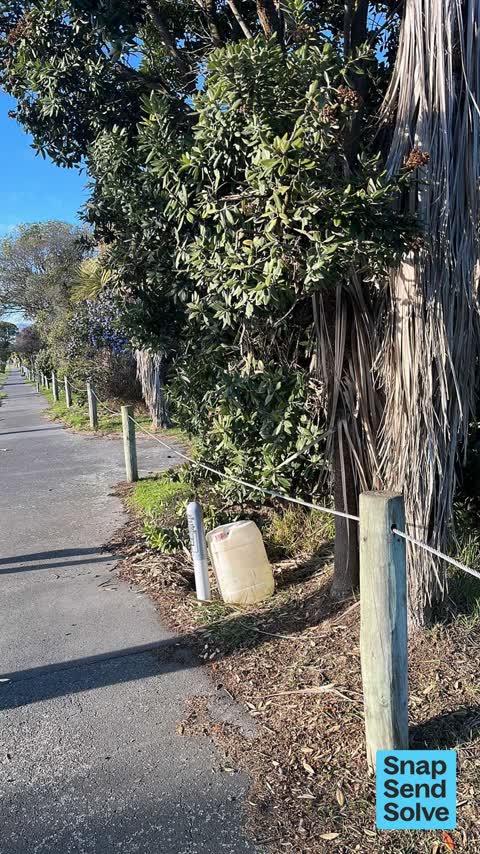
Garden waste and other rubbish dumped between playground and gateway to jetty
Reports per year down 3% 2024→2025
15
42
16
90
17
95
18
122
19
175
20
237
21
228
22
348
23
319
24
391
25
379
What gets reported
Streets that keep coming up each a street page
Exactly what people say
How fast the council fixes things here 3,576 finished jobs on record
The median council work order pinned in South New Brighton took 4 days to resolve, the city-wide median is 3 days, so this ground runs slower than the city as a whole. The slowest tenth waited 4 months or longer. 161 tickets are open here now, the oldest was filed 23 April 2020.
Work orders, not the resident reports above, the council’s MyCouncilTicket stream, and one job can appear in both. A median counts only finished jobs; open ones are named as open, never averaged in. The ticket roll · the whole city’s fix times.
Alcohol rules on this ground
One sensitive site stands here, South New Brighton School, and the Local Alcohol Policy restricts new off-licences within 200 m of it.
The council’s bylaw zones and the Local Alcohol Policy’s buffer list, read from the Regulatory open-data service. A ban rules drinking in public places; it says nothing about whether a premises may sell, that is the licence register’s job.
The suburb today
Schools here 1
- South New Brighton SchoolFull Primary · decile 6 · EQI 454
Zoned for Avonside Girls' High School · Christchurch Adventist School · Haeata Community Campus · Hillview Christian School · Marian College · Middleton Grange School · and 4 more zones, the drawn zone is indicative; the Ministry’s written scheme is the legal boundary.
Decile and EQI describe the community a school draws from, not how well it teaches.
The green here 4
- South New Brighton BeachRegional · 37 ha
- South New Brighton ParkSports ground · 30 ha · playground, 69 pieces
- Bridge Reserve7 ha
- Te Karoro Karoro Reserve2 ha · playground, 12 pieces
Parks and reserves in the council’s open data, a park lands in the suburb its centre falls inside. The whole roll is at /parks.
The tracks through here 1
- Walk and bike track through South New Brighton2.0 km · Christchurch · walk · bike
Tracks in the council’s open data, a line belongs to every suburb it passes through. The whole network is at /tracks.
The names on this ground 3
The February 2011 survey drew mapped ground failure over 16.4% of this outline, about 23 hectares. A patch is a footprint, not a finding about an address; the count for the whole city is at /liquefaction.
The 2011 grading filed 1.0% of this outline, mostly TC3. A graded area files under the suburb its middle sits in, and a category is a verdict for a patch of ground, not a finding about an address; the grades are drawn at /technical-categories.
The flood record drew water over 28.9% of this outline, about 40 hectares, across 1 named event. A patch is one event’s observation, not a live hazard finding; the whole record is drawn at /floods.
The mapped tsunami extent covers 83% of this outline, about 116 hectares. The sea’s modelled reach, not a prediction, the plan’s inundation line, not the evacuation zones; the share is read from a sampled join. The whole extent is drawn at /tsunami.
The files record 49 parcels of made or characterised ground inside this outline, mostly sand, pitrun, loess, 3 carry fill the file can’t vouch for. A record is the file’s word on what was laid, not a fresh survey; the whole layer is drawn at /fill.
3 parcels inside this outline carry a cleanup on the file, 3 marked verified. A cleanup on the file is the register’s word, not a clearance; the whole register is drawn at /remediated.
The 2019 liquefaction study put 46% of this outline in the possible class, 93% of the outline fell inside an assessed area, and 2 assessed areas here carry the free-face flag for possible lateral spreading. A class is the model’s verdict on a patch of ground, not a finding about an address; the whole study is drawn at /vulnerability.
The council’s structure register stands 19 assets on this ground, 9 boardwalks, 4 sets of steps, 3 boat ramps, 1 bridge, sited at South New Brighton Beach, South New Brighton Park, Estuary Rd And Beatty St, South Brighton Community Centr. The register’s site names are its own labels for the ground an asset stands in; the layer is drawn at the map.
The recreation register keeps 13 records inside this outline, bookable surfaces for 5 tennis, 2 cricket, 2 basketball, 2 football. Seasons and surfaces are the register’s record, not this week’s draw; the layer is drawn at the map.
The register counts 507 living trees inside this outline, 3 veterans among them, 7 carrying a protection, mostly Cabbage tree, Pohutukawa, Ngaio. The file remembers 198 trees felled here. A tree record is the register’s word on what stands or stood; the whole canopy is drawn at /trees.
The plan files 40% of this outline under Residential Suburban, 40% residential, the rest mostly Open Space Coastal 20%, Open Space Community Parks 18%. A zone is a permission, not a description, the mix is read from a sampled join of the plan’s polygons; the whole district is drawn at /zones.
The plan reserves about 1 hectares of this outline, 1%, under 1 designation, mostly learning. A designation is a claim on the ground, not a build date, the mix is read from a sampled join; the whole register is drawn at /designations.
The plan’s exceptions touch 1% of this outline, 3 qualifying matters, mostly section 6. A matter narrows how the density rule applies, it does not forbid; the mix is read from a sampled join, and the cultural-significance areas are the plan’s own unnamed ones. The whole register is drawn at /matters.
The plan’s schedule of sites significant to Ngāi Tahu covers 30% of this outline, about 42 hectares, ngā tūranga tūpuna, ngā wai. Shares read from a sampled join; a recognition overlay, not a catalogue. The whole schedule is drawn at /cultural.
The plan’s ecological schedules cover 28% of this outline, about 40 hectares across 2 scheduled sites, all protected under Schedule A. Shares read from a sampled join; a recognition overlay, not a survey. The whole ledger is drawn at /ecology.
The plan’s landscape schedules cover 49% of this outline, about 69 hectares across 6 scheduled areas, 20% of it outstanding, the plan’s strongest landscape standing, and 97% of it sits inside the coastal environment. Shares read from a sampled join; a protection overlay, not a ranking of views. The kept view is drawn at /landscape.
The plan’s flood map draws 22% of this outline inside high flood hazard ground, about 31 hectares across 6 mapped areas. The broader flood-management watch covers 67% of it, Southshore. Shares read from a sampled join; a model’s map, not a promise. The waiting water is drawn at /flood-hazard.
The plan’s water-margin layers cross this outline, 5 classified reaches, the plan calling Beatty Street Drain and Pleasant Point Domain Drain by name, 1% of it inside the setback strips, the widest holding 20 m off the bank, and an esplanade line holds a public edge here. The margin is the plan’s drawing, not a survey of the bank; the reaches, strips and held edges are mapped at /water-margin.
The rebuild’s cameras filed 925 photographs on this ground, 2010–2015, stormwater work mostly. Each frame is a receipt the dig left behind, a work log, not a survey of what stands now; the whole record is drawn at /rebuild.
The remembered names stand on this ground, 5 inscribed plaques, South Brighton Community Centr, Te Karoro Karoro Reserve, South New Brighton Park among the grounds. The plaque is the register’s pin, not a surveyed spot; the whole roll is kept at /plaques.
The rulebook binds this ground, 9 drawn instruments, 6 of them dog rules, 2 camping zones, a certified self-contained van can stay the night at City Coastal Restricted Zone; the other zone bans it outright, 1 bottle-store buffer; the outline sits inside the takiwā of Te Ngai Tuahuriri Runanga. The bylaw is the instrument, this the map of it, the whole rulebook is drawn at /rules.
GeoNet’s catalogue puts 8 magnitude-3+ epicentres inside this outline since the sequence opened, the biggest a M4.0 in 2011. An epicentre is where the instruments placed the break, not a measure of the shaking here; the whole catalogue is counted at /sequence, the live record is /quakes, and the story in plain language is the earthquakes explainer.
- Estuary Roadold dump · 1941–1943
- Te Kai-a-Te-Karoroold site
- Avon River / Ōtākarowaterway · 29.2 km
The named waterways, bays, headlands, monuments, summits and old sites OpenStreetMap puts inside this outline, a pin is the mapper’s own; a waterway belongs to every suburb it crosses. Every roll, counted: /geography.
The crash record 25 injury crashes
25 crashes that hurt somebody on record inside South New Brighton's outline, 3 people killed, 8 seriously hurt.
The corner that keeps appearing: Estuary Road at Beatty Street, 4 injury crashes.
The crime record 332 recorded victimisations
332 victimisations on the Police record inside South New Brighton’s outline, September 2022–August 2026, mostly theft, about 25 a year per 1,000 residents. Up 8% on the year before. Reported is not all, how much never reaches the record depends on the offence.
The buses through it 15 stops
15 Metro stops inside South New Brighton's outline, in ECan’s stop record, served by route 60.
- Estuary Rd
- Estuary Rd near Beatty St near Estuary Rd
- Estuary Rd near Beatty St near Estuary Rd
- Estuary Rd near Cradock St near Estuary Rd
- Estuary Rd near Cradock St near Estuary Rd
- Estuary Rd near Ebbtide St near Estuary Rd
- Estuary Rd near Ebbtide St near Estuary Rd
- Estuary Rd near Ebbtide St near Estuary Rd
- Estuary Rd near Halsey St near Estuary Rd
- Estuary Rd near Halsey St near Estuary Rd
- Estuary Rd near Halsey St near Estuary Rd
- Estuary Rd near Jellicoe St near Estuary Rd
- Estuary Rd near Jellicoe St near Estuary Rd
- Estuary Rd near Sandra St near Estuary Rd
- Estuary Rd near Sandra St near Estuary Rd
Businesses here 4 in the directory
4 premises in South New Brighton across 3 kinds, from OpenStreetMap, the council’s licensed-premises register and its 2024 Find Christchurch directory. Each kind below opens at this suburb’s shelf.
Before any of that
Documents 40
What the archive’s sources say about South New Brighton, titled for it, turned up by a search for one of its places, or carrying its name in the text. These are leads and citations: the originals live at the provider, linked from each row.
1860s
1880s
91890s
1900s
101910s
101920s
61930s
31940s
1950s
82000s
52010s
Page 2 Advertisements Column 1 (Grey River Argus, 11 August 1868)Grey River Argus · Papers Past · National Library of New Zealand · · text held
CHRISTCHURCH. (Poverty Bay Herald, 31 May 1882)Poverty Bay Herald · Papers Past · National Library of New Zealand · · text held
New Brighton Steamer. (Star, 16 May 1891)Star · Papers Past · National Library of New Zealand · · text held
CHRISTCHURCH. January 19. (North Otago Times, 21 January 1895)North Otago Times · Papers Past · National Library of New Zealand · · text held
CHRISTCHURCH. (Wanganui Herald, 21 January 1895)Wanganui Herald · Papers Past · National Library of New Zealand · · text held
CHRISTCHURCH ITEMS. (Wanganui Chronicle, 12 August 1895)Wanganui Chronicle · Papers Past · National Library of New Zealand · · text held
SWIMMING. (Star, 17 December 1895)Star · Papers Past · National Library of New Zealand · · text held
THE RECRD REIGN. (Star, 16 June 1897)Star · Papers Past · National Library of New Zealand · · text held
SOUTH ISLAND TROTTING ASSOCIATION. (Auckland Star, 27 November 1897)Auckland Star · Papers Past · National Library of New Zealand · · text held
NEW YEAR'S DAY. (Star, 30 December 1897)Star · Papers Past · National Library of New Zealand · · text held
The rest are a search away, the whole shelf, for the name →
The wire on South New Brighton 5 lately
Something seen — Estuary Rd near Cradock St, South New Brighton, Christchurch 8062, New ZealandiNaturalist · michael33768 ·
Sacred Kingfisher seen — Estuary Rd near Jellicoe St, South New Brighton, Christchurch 8062, New ZealandiNaturalist · smankelow ·
Gossamer grass seen — Estuary Rd near Cradock St, South New Brighton, Christchurch 8062, New ZealandiNaturalist · scott_butcher ·
Karoro (Black-backed Gull) seen — Estuary Rd near Ebbtide St, South New Brighton, Christchurch 8062, New ZealandiNaturalist · ecoman ·
Mudflat Tītiko seen — South New Brighton, Christchurch 8062, New ZealandiNaturalist · rowananddevon ·
Next door
Compare South New Brighton with Southshore · Bexley · New Brighton · Aranui · Bromley · Redcliffs, same record, side by side.
Questions, answered briefly
What is South New Brighton?
South New Brighton is a coastal suburb on the eastern side of Christchurch city. The public record holds 2,672 council reports for it, the first filed in June 2015.
How many people live in South New Brighton?
3,420 people at the 2023 Census, 2,459 per square kilometre across 1.4 km².
How many people does the 2023 Census count for South New Brighton?
About 3,321 people and 1,296 occupied private households: grouped from Stats NZ SA1 areas through this site’s suburb join. Indicative, not a LIM.
What gets reported in South New Brighton?
2,672 reports on record, most often rubbish & dumping (633), graffiti & vandalism (580), trees & parks (567). 315 of them in the year to 14 October 2026.
How many crashes has South New Brighton had?
25 injury crashes on the police record inside the suburb’s outline, 3 people killed, 8 seriously hurt. The suburb’s crashes, mapped →
Did earthquakes strike under South New Brighton?
GeoNet’s catalogue puts 8 magnitude-3+ epicentres inside the suburb’s mapped outline since the September 2010 mainshock, the biggest a M4.0 in 2011. An epicentre is where the instruments placed the break, not a measure of the shaking felt here. The whole sequence, counted → · The story, in plain language →
Every suburb in Christchurch → · Its decade, charted → · the whole A–Z →